
Deep learning, machine learning, artificial intelligence - all buzzwords and representative of the future of analytics. In this post we will explain what is ...
Deep learning, machine learning, artificial intelligence — all buzzwords that represent the future of analytics. In this post, we will explain what machine learning and deep learning are at a high level with some real-world examples. In future posts, we will explore vertical use cases. The goal of this is not to turn you into a data scientist but to give you a better understanding of what you can do with machine learning. Machine learning is becoming more accessible to developers, and data scientists work with domain experts, architects, developers, and data engineers, so it is important for everyone to have a good understanding of the possibilities. Every piece of information that your business generates has the potential to add value. This post and future posts are meant to provoke a review of your own data to identify new opportunities.
What Is Artificial Intelligence?
Throughout the history of AI, the definition has been continuously redefined. AI is an umbrella term (the idea started in the 50s); machine learning is a subset of AI and deep learning is a subset of ML.

In 1985, when I was a student interning at the NSA, AI was also a very hot topic. At the NSA, I even took an MIT video (VCR) class on AI about expert systems. Expert systems capture an expert's knowledge in a rules engine. Rules engines have a wide use in industries such as finance and healthcare, and more recently for event processing, but when data is changing, rules can become difficult to update and maintain. Machine learning has the advantage that it learns from the data, and it can provide data-driven probabilistic predictions.

According to Ted Dunning, it is better to use precise terminology like machine learning ordeep learning instead of the term "AI" because before we get something to work well, we call it AI; afterward, we always call it something else. AI is better used as a word for the next frontier.
How Has Analytics Changed in the Last 10 Years?
According to Thomas Davenport in the HBR, analytical technology has changed dramatically over the last decade, with more powerful and less expensive distributed computing across commodity servers, streaming analytics, and improved machine learning technologies, enabling companies to store and analyze both far more data and many different types of it.
Traditionally, data was stored on a RAID system, sent to a multi-core server for processing, and sent back for storage, which caused a bottleneck on data transfer and was expensive. With file and table storage like MapR-XD and MapR-DB, data is distributed across a cluster and Hadoop technologies like MapReduce, Pig, and Hive send the computing task to where the data resides.

Technologies like Apache Spark speed up parallel processing of distributed data even more with iterative algorithms by caching data in-memory across iterations and using lighter weight threads.

MapR Event Streams, a new distributed messaging system for streaming event data at scale, combined with Stream processing like Apache Spark streaming or Apache Flink speed up parallel processing of real-time events with machine learning models.

Graphical Processing Units (GPUs) have sped up multi-core servers for parallel processing. A GPU has a massively parallel architecture consisting of thousands of smaller, more efficient cores designed for handling multiple tasks simultaneously, whereas a CPU consists of a few cores optimized for sequential serial processing. In terms of potential performance, the evolution from the Cray-1 to today’s clusters with lots of GPU’s is roughly a million times what was once the fastest computer on the planet at a tiny fraction of the cost.

What Is Machine Learning?
Machine learning uses algorithms to find patterns in data and then uses a model that recognizes those patterns to make predictions on new data.

In general, machine learning may be broken down into types: supervised, unsupervised, and in between those two. Supervised learning algorithms use labeled data and unsupervised learning algorithms find patterns in unlabeled data. Semi-supervised learning uses a mixture of labeled and unlabeled data. Reinforcement learning trains algorithms to maximize rewards based on feedback.

Supervised Learning
Supervised algorithms use labeled data in which both the input and target outcome, or label, are provided to the algorithm.

Supervised learning is also called predictive modeling or predictive analytics because you build a model that is capable of making predictions. Some examples of predictive modeling are classification and regression. Classification identifies which category an item belongs to (for example whether a transaction is fraud or not fraud) based on labeled examples of known items (for example, transactions known to be fraud or not). Logistic regression predicts a probability — for example, the probability of fraud. Linear regression predicts a numeric value — for example, the amount of fraud.

Some examples of classification include:
- Credit card fraud detection (fraud, not fraud).
- Credit card application (good credit, bad credit).
- Email spam detection (spam, not spam).
- Text sentiment analysis (happy, not happy).
- Predicting patient risk (high-risk patient, low-risk patient).
- Classifying a tumor as malignant or not.
Some examples of logistic regression (or other algorithms) include:
- Given historical car insurance fraudulent claims and features of the claims such as the age of the claimant, the claimed amount, and the severity of the accident, predict the probability of fraud.
- Given patient characteristics, predict the probability of congestive heart failure.
Some examples of linear regression include:
- Given historical car insurance fraudulent claims and features of the claims such as the age of the claimant, the claimed amount, and the severity of the accident, predict the amount of fraud.
- Given historical real estate sales prices and features of houses (i.e. square feet, number of bedrooms, location), predict a house’s price.
- Given historical neighborhood crime statistics, predict crime rate.
There are other supervised and unsupervised learning algorithms shown below, which we won’t go over, but we will look at one example of each in more detail.

Classification Example: Debit Card Fraud
Classification takes a set of data with known labels and pre-determined features and learns how to label new records based on that information. Features are the “if” questions that you ask. The label is the answer to those questions.

Let’s go through an example of debit card fraud.
- What are we trying to predict?
- Whether a debit card transaction is fraud.
- Fraud is the label (true or false).
- What are the “if” questions or properties that you can use to make predictions?
- Is the amount spent today > historical average?
- Are there transactions in multiple countries today?
- Are the number of transactions today > historical average?
- Are the number of new merchant types today high compared to the last three months?
- Are there multiple purchases today from merchants with a category code of risk?
- Is there unusual signing activity today compared to using historically using PIN?
- Are there new state purchases compared to the last three months?
- Are there foreign purchases today compared to the last three months?
To build a classifier model, you extract the features of interest that most contribute to the classification.
Decision Trees
Decision trees create a model that predicts the class or label based on several input features. Decision trees work by evaluating a question containing a feature at every node and selecting a branch to the next node based on the answer. A possible decision tree for predicting debit card fraud is shown below. The feature questions are the nodes, and the answers “yes” or “no” are the branches in the tree to the child nodes. (Note that a real tree would have more nodes.)
- Q1: Is the amount spent in 24 hours > average?
- Yes
- Q2: Are there multiple purchases today from risky merchants?
- Yes fraud = 90%
- Not fraud = 50%

Decision trees are popular because they are easy to visualize and explain. The accuracy of models can be improved by combining algorithms with ensemble methods. An ensemble example is a random forest, which combines multiple random subsets of decision trees.
Unsupervised Learning
Unsupervised learning, also sometimes called descriptive analytics, does not have labeled data provided in advance. These algorithms discover similarities or regularities in the input data. An example of unsupervised learning is grouping similar customers based on purchase data.

Clustering
In clustering, an algorithm classifies inputs into categories by analyzing similarities between input examples. Some clustering use cases include:
- Search results grouping.
- Grouping similar customers.
- Grouping similar patients.
- Text categorization.
- Network security anomaly detection (finds what is not similar, the outliers from clusters).

The K-means algorithm groups observations into K clusters in which each observation belongs to the cluster with the nearest mean from its cluster center.

An example of clustering is a company that wants to segment its customers in order to better tailor products and offerings. Customers could be grouped on features such as demographics and purchase histories. Clustering with unsupervised learning is often combined with supervised learning in order to get more valuable results. For example, in this banking customer 360 use case, customers were first segmented based on answers to a survey. The customer groups were analyzed and labeled with customer personas. These labels were then linked by customer ID with features such as types of accounts and purchases. Finally, supervised machine learning was applied and tested with the labeled customers, allowing to link the survey customer personas with their banking actions and provide insights.

Deep Learning
Deep learning is the name for multilayered neural networks, which are networks composed of several “hidden layers” of nodes between the input and output. There are many variations of neural networks, which you can learn more about on this neural network cheat sheet. Improved algorithms, GPUs, and massively parallel processing (MPP) have given rise to networks with thousands of layers. Each node takes input data and a weight and outputs a confidence score to the nodes in the next layer until the output layer is reached where the error of the score is calculated. With backpropagation inside of a process called gradient descent, the errors are sent back through the network again and the weights are adjusted improving the model. This process is repeated thousands of times, adjusting a model’s weights in response to the error it produces until the error can’t be reduced anymore.

During this process, the layers learn the optimal features for the model, which has the advantage that features do not need to be predetermined. However, this has the disadvantage that the model’s decisions are not explainable. Because explaining the decisions can be important, researchers are developing new ways to understand the black box of deep learning.
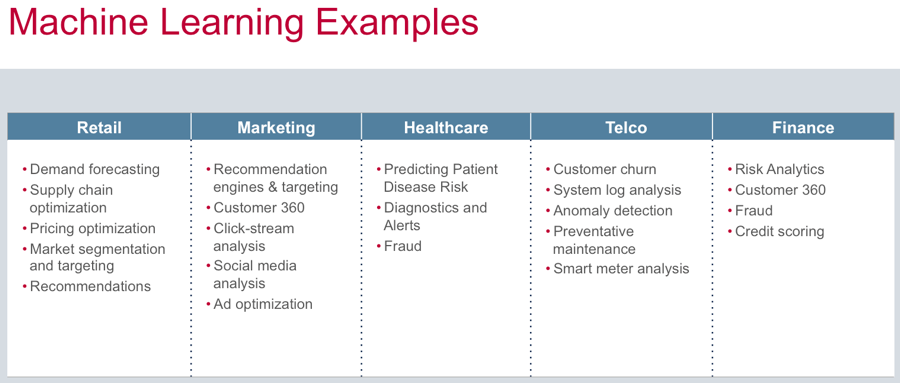
There are different variations of Deep Learning Algorithms, which can be used with the Distributed Deep Learning Quick Start Solution from MapR to build data-driven applications such as the following:
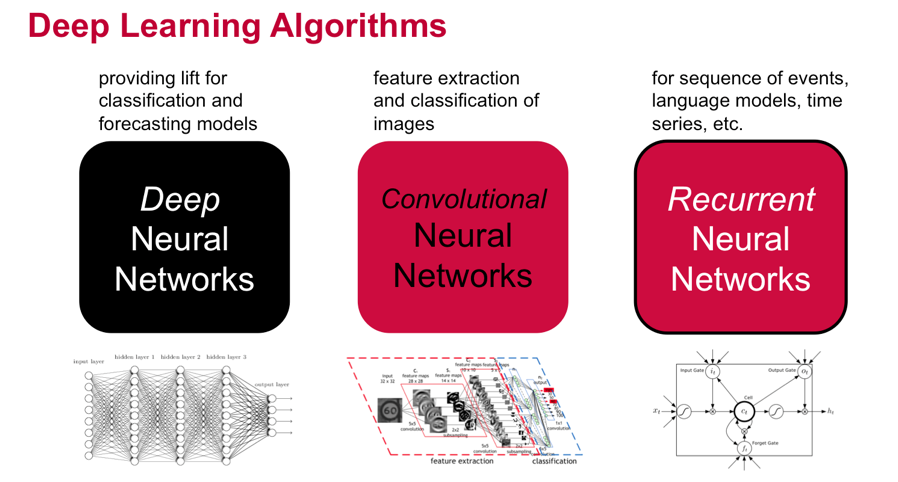
Deep neural networks for improved traditional algorithms.
- Finance: Enhanced fraud detection through identification of more complex patterns.
- Manufacturing: Enhanced identification of defects based on deeper anomaly detection.
Convolutional neural networks for images.
- Retail: In-store activity analysis of video to measure traffic.
- Satellite images: Labeling terrain and classifying objects.
- Automotive: Recognition of roadways and obstacles.
- Healthcare: Diagnostic opportunities from x-rays, scans, etc.
- Insurance: Estimating claim severity based on photographs.
Recurrent neural networks for sequenced data.
- Customer satisfaction: Transcription of voice data to text for NLP analysis.
- Social media: Real-time translation of social and product forum posts.
- Photo captioning: Search archives of images for new insights.
- Finance: Predicting behavior based via time series analysis (also enhanced recommendation systems).