
Introducing d3.express: the integrated discovery environment.
If you’ve ever gotten frustrated trying to figure out why your code doesn’t work, or how someone else’s code works, you are not alone. This is for you.
For the last eight years or so, I have been building tools for visualizing information. The most successful outcome of this effort has been D3, a JavaScript library. Yet a danger of spending so long designing a tool is that you may forget what the tool is for: the tool itself becomes the goal, rather than the value derived from its application.
The purpose of a visualization tool is to construct visualizations. But what is the purpose of visualization? Per Ben Shneiderman:
The purpose of visualization is insight, not pictures.
Visualization is a means to an end. A means to insight. A way to think, to understand, to discover, and to communicate something about the world. If we consider only the task of assigning visual encodings, of constructing visualizations, we ignore myriad other challenges: finding relevant data, cleaning it, transforming it into efficient structures, analyzing it with statistics, modeling, explaining our discoveries…
These tasks are often performed in code. Alas, coding is famously difficult! Even its name suggests impenetrability. Code originally referred to machine code: low-level instructions to be executed by a processor. Code has become more human-friendly since then, but it’s got a long way to go.

Ghost in the Shell (1995)
To give a comically dense example, here is a Bash command I wrote recently to generate a choropleth of population density of California. Actually, this just generates the simplified geometry; a few more commands are needed to produce the SVG.

This isn’t machine code. From the perspective of the machine, it’s extremely high-level programming. Yet it’s hardly natural language. There are weird punctuation marks. Cryptic abbreviations. Repeated nesting. And two languages: JavaScript awkwardly embedded within Bash.
Bret Victor gives this concise definition of programming:
Programming is blindly manipulating symbols.
By “blindly”, he means we can’t see the results of our manipulation. We can edit a program, re-run it, and diff the output, but programs are complex and dynamic, so this is neither a direct nor an immediate observation of our edit. By “symbols”, he means we don’t manipulate the output of our program directly but instead work in abstractions. These abstractions may be powerful, but they can also be difficult to grasp. In Donald Norman’s terms, these are the gulf of evaluation and the gulf of execution.
But clearly some code is easier to understand than others. One symptom of inhuman code is spaghetti: code that lacks structure or modularity; where in order to understand one part of a program you have to understand the entirety of it. This is frequently caused by shared mutable state. When a piece of state is modified by multiple parts of a program, it is much harder to reason about its value.
Indeed, how do we know what a program does? If we can’t track its complete runtime state in our heads, reading code is insufficient. We use logs, debuggers, and tests, but these tools are limited. A debugger, for example, can only show a few values at a single moment in time. We continue to have great difficulty understanding code, and it can feel like a miracle that anything works at all.
Despite these challenges, we’re still writing code, for myriad applications, more than ever before. Why? Are we masochists? (Maybe.) Are we unable to change? (In part.) Is there no better solution?
In general — and that is the critical qualifier — no. Code is often the best tool we have because it is the most general tool we have; code has almost unlimited expressiveness. Alternatives to code, as well as higher-level programming interfaces and languages, do well in specific domains. But these alternatives must sacrifice generality to offer greater efficiency within their domain.
If you can’t constrain the domain, it’s unlikely you’ll find a viable replacement for code. There is no universal replacement, at least not while humans primarily think and communicate through language. And it’s hard to constrain the domain of science. Science is fundamental: to study the world, to extract meaning from empirical observations, to simulate systems, to communicate quantitative results.
A medium to support discovery must be capable of expressing novel thought. Just as we don’t use phrasal templates for composing the written word, we can’t be limited to chart templates for visualization or a drop-down of formulas for statistical analysis. We need more than configuration. We need the composition of primitives into creations of our own design.
If our goal is to help people gain insight from observation, we must consider the problem of how people code. Victor had the following to say about math, but it applies equally to code:
The power to understand and predict the quantities of the world should not be restricted to those with a freakish knack for manipulating abstract symbols.
Improving the human experience of coding is not just about making your workflow more convenient or efficient. It empowers people to better understand their world.
Introducing d3.express
If we can’t eliminate coding, can we at least make it easier for humans, with our sausage fingers and finite-sized brains?
To explore this question I am building an integrated discovery environment called d3.express. It’s for exploratory data analysis, for understanding systems and algorithms, for teaching and sharing techniques in code, and for sharing interactive visual explanations. To make visualization easier—to make discovery easier—we first need to make coding easier.
I cannot pretend to make coding easy. The ideas we wish to express, explore and explain may be irreducibly complex. But by reducing the cognitive burden of coding, we can make the analysis of quantitative phenomena accessible to a wider audience.
1. Reactivity
The first principle of d3.express is reactivity. Rather than issuing commands to modify shared state, each piece of state in a reactive program defines how it is calculated, and the runtime manages their evaluation; the runtime propagates derived state. If you’ve written spreadsheet formulas, you’ve done reactive programming.
Here’s a simple notebook in d3.express to illustrate reactive programming. It looks a bit like the browser’s developer console, except here our work is saved automatically so that we can revisit it in the future or share it with others. And it’s reactive.

In imperative programming, c = a + b sets the current value of c to a + b. This is a value assignment. If a or b changes, c retains its original value until we execute a new value assignment to c. In reactive programming, c = a + b is a variable definition. This means that c is always equal to a + b, even if a or b changes. The runtime keeps the value of c up-to-date.
As programmers, we now care only about the current state. The runtime manages state changes. That may seem like a small thing here, but in larger programs this eliminates a substantial burden.
A discovery environment needs to do more than add a few numbers, so let’s try working with data. To load the data — a few years of Apple stock price — we’ll use d3.csv. This uses the Fetch API to download a file from GitHub, and then parses it to return an array of objects.

Requiring D3 and fetching data are asynchronous. Imperative asynchronous code can be a challenge, but here we hardly notice: cells that reference d3aren’t evaluated until d3 is loaded, and likewise cells that reference data aren’t evaluated until data is loaded. Reactivity means we can write most asynchronous code as if it were synchronous.
What does the data look like? Let’s inspect:

d3.csv is conservative and doesn’t infer types like numbers and dates, so the fields are strings. We need more precise types. We can convert the close field to a number by applying the unary plus operator (+), and immediately see the effect: the purple string changes to a green number.

Parsing the date is slightly more work as JavaScript doesn’t natively support this format. Imagine there’s a parseTime function that parses a string and returns a Date instance. What would happen if we called it?

Oops! It throws an error. But the error is both local and temporary: other cells are unaffected, and the error will disappear when we define parseTime. Thus notebooks in d3.express are not only reactive, they are structured. Global errors no longer exist.
Upon defining parseTime, we again see the effect: the data is reloaded, parsed and displayed. We are still manipulating abstract symbols, but we are at least doing so less blindly.

Now we can question the data, say to compute its date range:

Oops, we forgot to name the data. Let’s fix that:

And this reveals another human-friendly feature: cells can be written in any order. The data cell can appear after cells that reference it because the runtime maintains a directed acyclic graph of references and evaluates the graph in topological order.
Visual Outputs
Like the developer console, the result of evaluating a cell in d3.express is visible immediately beneath the code. But unlike the console, cells in d3.express can output graphical user interfaces! So let’s visualize our data as a simple line chart.
First we define the chart size: width, height, and margin.

Then scales: a time scale for x, and a linear scale for y.

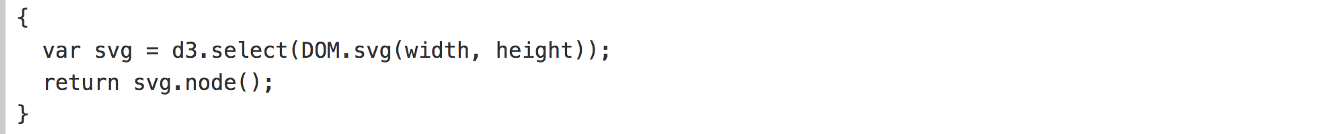
Lastly an SVG element. As this definition will grow more involved than our previous cells, we can use curly braces ({ and }) to define it as a block statement rather than an expression:

DOM.svg is a convenience method for document.createElementNS; it returns a new SVG node with the given width and height. Let’s expand this to use d3-selection for DOM manipulation:
I can’t show the code and the chart simultaneously due to limited screen space, so let’s first watch the chart as it is assembled incrementally. This gives a sense of the visual feedback you receive as you place the chart’s three major components: the x-axis, the y-axis, and the line.

This animation was made by applying each line of code below in order (except the return statement, since that’s needed to see anything):

This is a basic chart, but already the program’s topology is becoming more complex. Here is its directed acyclic graph of references, itself made in d3.express using GraphViz:

The numbered node 93 is the SVG element. A few observations. It’s now trivial to make this chart responsive. The width, height and margin are constants, but if they were dynamic, the scales and the chart would update automatically. Likewise, it’s trivial to turn this into a dynamic chart by redefining data; we’ll see that in action with streaming data shortly.
But let’s look more closely at the reactive code. In imperative programming, a variable definition tends to be sprinkled throughout the code rather than in one place. For example, we might construct the x-scale on page load but defer setting its domain until the data loads.

This fragmented definition could be interspersed with unrelated code, impeding readability. In reactive programming, we can localize the definition and let the runtime manage execution order:

Reactivity is thus not just a time-saving convenience; it results in cleaner code. This also improves reusability: self-contained, stateless definitions are easier to copy-and-paste or import into other documents.
Also, you don’t have to use D3; despite the name, nothing in d3.express requires it. You can create whatever DOM — HTML, canvas, WebGL — using whatever libraries you want. Here’s the chart in Vega Lite:

Animation
How about Canvas? Say we want a globe. We can fetch world country boundaries, and then apply an orthographic projection.


A powerful feature of reactive programming is that we can rapidly substitute a static definition, such as this fixed-aspect orthographic projection, with a dynamic definition, such as a rotating projection. The runtime will re-evaluate the canvas whenever the projection changes.

Dynamic variables in d3.express are implemented as generators, which are functions that can yield multiple values. For example, a generator with a while-true loop yields an infinite stream of values. The runtime pulls a new value from each active generator up to sixty times a second.

(This looks better at 60 FPS.)
Our canvas definition creates a new canvas each time it’s run. That may be acceptable, but we can get better performance by recycling the canvas. A variable’s previous value is exposed as the keyword this.

Oops. By reusing the old canvas, the globe starts to smear:

This glitch is easily fixed by clearing the old canvas before redrawing:

Thus by adding a little complexity you can improve performance, and the resulting animation has negligible overhead compared to vanilla JavaScript.
Interaction
If generators are good for scripted animations, what about interaction? Generators again to the rescue! Only now our generators are asynchronous, yielding a promise that resolves whenever there is new input.
To make the rotation interactive, let’s first define a range input. Then we connect it to a generator that yields the current value of the input whenever it changes. We could implement this generator by hand, but there’s a built-in convenience method called Generators.input.

Now we substitute the input’s value as the rotation longitude for an interactive globe:

This is already a concise definition of a user interface. But we can shorten it further by collapsing the range and angle definitions into a single cell using d3.express’ viewof operator. This displays the input to the user, but exposes the input’s current value to code.

The ability to display arbitrary DOM and expose arbitrary values to code makes interfaces in d3.express very, well… expressive. You’re not limited to sliders and drop-down menus. Here is a Cubehelix color picker implemented as a table of sliders, one for each color channel.

When you drag an input, its value is updated on the adjacent output, and then the generator yields the current color.

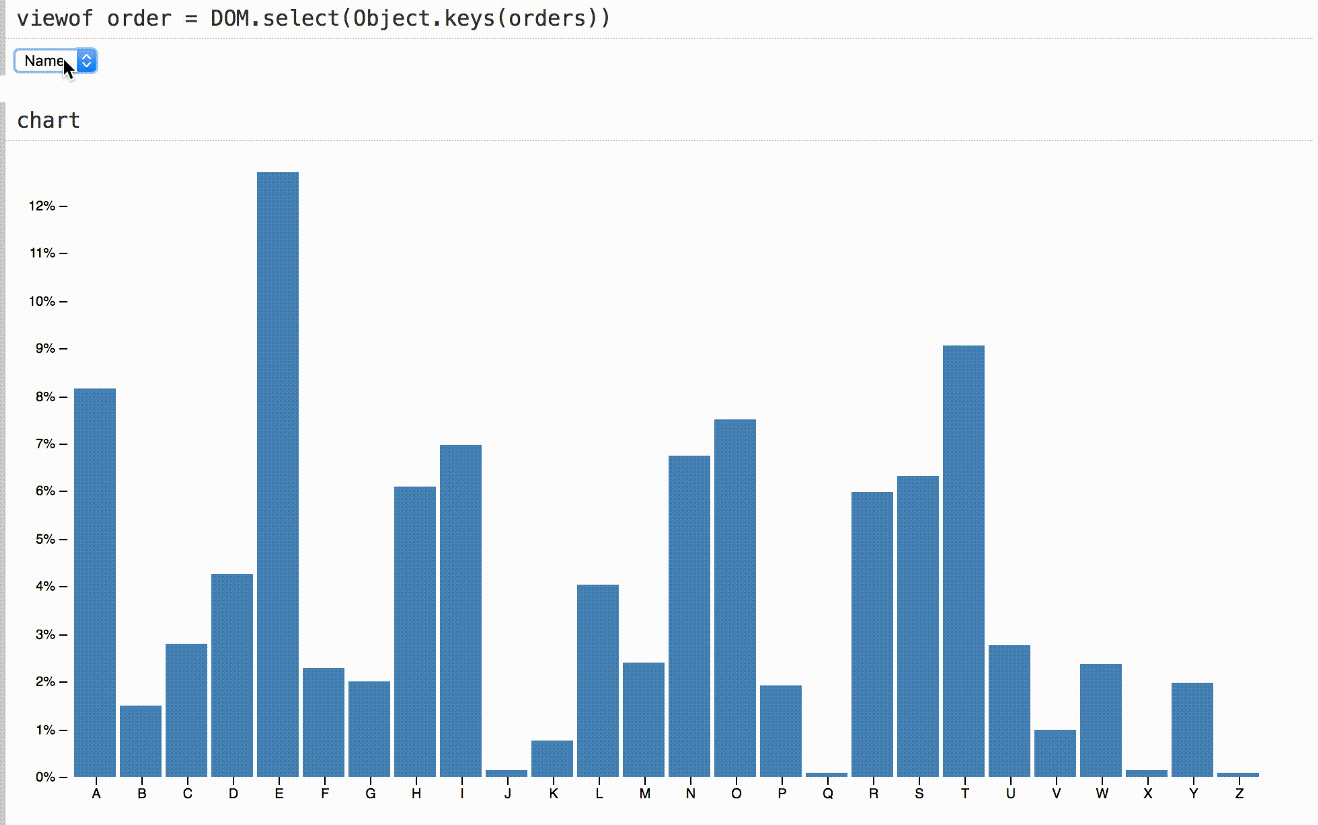
We can create whatever graphical interfaces we want. And we can design sensible programming interfaces to expose their values to code. This affords the rapid construction of powerful interfaces for exploring data. Here is a histogram showing the performance of a few hundred stocks over a recent five-year period. (I’ve abbreviated the code, but it’s similar to this.)

In other environments, a histogram like this might be a visual dead-end; you can look at it, but inspecting the underlying values requires separately querying the data in code. In d3.express, we can quickly augment a visualization to expose its selection interactively. Then we can inspect the underlying data points by direct manipulation.

This uses the default object inspector, but you can drive anything interactively, say live summaries, live statistics, or even linked visualizations.

To show this isn’t magic, above is the code to adapt d3-brush to d3.express. When there’s a brush event, we compute the new filtered selection of data, set it as the SVG node’s value, and dispatch an input event.
Animated Transitions
By default, reactions are instantaneous: when a variable’s value changes, the runtime recomputes derived variables and updates the display immediately. But immediacy is not required and it is sometimes useful to animate transitions for object constancy. Here, for example, we can follow the bars as they are reordered:
Understanding this chart’s implementation requires familiarity with D3 (sorry… baby steps!), namely keyed data-joins and staggered transitions, but even if this code is opaque, it hopefully demonstrates that today’s open-source libraries are readily used in d3.express with little friction.

2. Visibility
Inline visual outputs improve our ability to inspect the program’s current state. Interactive programming improves our ability to scrutinize behavior by poking: changing, deleting, reordering code, and seeing what happens. For example, by commenting out forces in the force-directed graph below, we get a better sense of their contribution to the layout.

(See a longer video of me tinkering on YouTube.)
You’ve likely seen tinker toys like this before—Steve Haroz for example has a lovely playground for d3-force. Here you don’t have to build a user interface to play; it comes for free with interactive programming!
Visualizing Algorithms
A more explicit approach to studying program behavior is to augment the code to expose internal state. Generators help here, too. We can take a normal function, like this one for summing an array of numbers:

And turn it into a generator that yields local state during execution, in addition to the normal return value at the end:

Then we can visualize or inspect the internal state to understand the behavior. This approach offers a clean separation between our implementation of the algorithm and our exploration of it, rather than embedding visualization code directly inside the algorithm.

As an example, let’s explore D3’s hierarchical circle-packing layout.

Source: bl.ocks.org/mbostock/ca5b03a33affa4160321
We have a set of circles that we want to pack into as small a space as possible without overlap, like huddling penguins 🐧 in Antarctica. Our job is to place circles one at a time until all circles have been placed.
Since we want the circles to be packed as tightly as possible, it’s fairly obvious that each circle we place must be tangent to at least one (actually two) of the circles we’ve already placed. But if we pick an existing circle at random as the tangent circle, we’ll waste a lot of time trying to put the new circle in the middle of the pack, where it will overlap other circles. Ideally we only consider circles that are on the outside of the pack. But how can we efficiently determine which circles are on the outside?
Wang’s algorithm maintains a “front chain”, shown here in red, which represents these outermost circles. When placing a new circle, it picks the circle on the front chain that is closest to the origin. The new circle is placed tangent to this circle and its neighbor on the front chain.
If this placement does not overlap with any other circle on the front chain, the algorithm moves to the next circle. If it does overlap, then we cut the front chain between the tangent circles and the overlapping circle, and the overlapping circle becomes a new tangent circle. We repeat this process until there is no overlap.


I find this animation mesmerizing. If you look closely, you can see brief moments where a larger circle is squeezed out of the pack as the front chain is cut. But more than being eye candy, this notebook was extremely useful for fixing a longstanding bug in D3’s implementation, where very rarely it would cut the wrong side of the front chain and circles would overlap.
Once we’ve packed our circles, we need to compute the enclosing circle for the pack so that circle-packing can be repeated up the hierarchy. The conventional way of doing this is to scan the front chain for the circle that is farthest from the origin. This is a decent approximation, but not exact. Fortunately there’s a simple extension of Welzl’s algorithm for computing the smallest enclosing circle in linear time.

To see how Welzl’s algorithm works, let’s assume we already know the enclosing circle for some circles and want to incorporate a new circle. If the new circle is inside the current enclosing circle, we can move on to the next circle. If the new circle is outside the current enclosing circle, we must expand the enclosing circle.


When a circle is outside the enclosing circle it must be tangent to the new enclosing circle.
However, we know something about this new circle: it is the only circle that is outside the enclosing circle, and thus it must be tangent to the new enclosing circle. And if we know how to find one tangent circle for the enclosing circle, we can find the others recursively!
There’s some geometry I’m glossing over, of course. We also need to compute the boundary cases for recursion: the enclosing circles for one, two or three tangent circles. (This is the Problem of Apollonius.) Geometry also dictates that there can’t be more than three tangent circles — or the enclosing circle already contains all the circles—so we know that our recursive approach will eventually terminate.
Here’s a more complete view of the recursive algorithm, showing the stack:

The left is the topmost level, where the set of tangent circles is empty. The algorithm recurses whenever the new circle is outside the enclosing circle. That new circle is to pushed onto the set of tangent circles during recursion. So from left-to-right, there are zero, one, two and three tangent circles, filled in black.
In addition to showing how this algorithm works, this animation gives a sense of how much time the algorithm spends at different levels of recursion. Because it processes the circles in random order, the enclosing circle expands quickly to approximate the final answer. But whenever it recurses, it must rescan all the earlier circles to make sure they fit within the new enclosing circle.
3. Reusability
One way to write less code is to reuse it. The 440,000 or so packages published to npm attest to the popularity of this approach.
But libraries are an example of active reusability: they must be intentionally designed to be reusable. And this is a substantial burden; it can be hard to design an effective general abstraction! (Ask any open-source maintainer.) Implementing “one-off” code, as is common in D3 examples, is easier because you need only consider the specific task at hand and not an abstract class of tasks.
I’m exploring whether we can have better passive reusability in d3.express. Where by leveraging the structure of reactive documents, we can more easily repurpose code, even if that code wasn’t carefully designed to be reusable.
For starters, you can treat notebooks like de facto libraries. Say in one notebook I implement a custom color scale:

In another notebook, I can import the color scale to use it:

Imports are also useful if you created many notebooks to explore ideas, and want to combine them into an explainer.
More interestingly, d3.express lets you rewire variable definitions when you import them. Here I define a realtime dataset streaming over a WebSocket. (Again the details of this code are not critical; you can imagine a library to simplify it…)

This dataset has the same shape as our earlier line chart: an array of objects with a time and a value. Can we reuse the line chart? Yep! The with clause allows you to inject local variables into the imported variables, replacing the original definitions.

Not only can we inject our dynamic data into the previously static chart, we can also override the scales if desired. Here we fix the domains of the x- and y-scales to suitable extents for this data. The x-scale now shows the last sixty seconds or so.

Adding the new definitions of x and y to the with clause, the chart now slides smoothly at 60 FPS, and the y-scale no longer bounces distractingly:

(This looks better at 60 FPS.)
4. Portability
Notebooks in d3.express run in the browser, not in a desktop app or in the cloud; there is a server to save your edits, but all computation and rendering happens locally in the client. What does it mean to have a web-first discovery environment?
A web-first environment embraces web standards, including vanilla JavaScript and DOM. It works with today’s open source, whether that’s code snippets you find on the web or libraries published to npm. It minimizes the specialized knowledge you need to be productive in the new environment.
There is new syntax in d3.express for reactivity, but I’ve tried to keep it as small and as familiar as possible, such as by using generators. These are the four forms of variable definition:

The standard library likewise is minimal, and not tied to the platform. You should be able to bring your existing code and knowledge into d3.express, and likewise take your code and knowledge out of d3.express.
A web-first environment lets your code run anywhere because it runs in the browser. There’s nothing to install. It becomes easier for others to repeat and validate your analysis. By extension, your code for exploration can gracefully transition into code for explanation. You don’t have to start over from scratch when you want to communicate your insights.

Source: github.com/TheUpshot/leo-senate-model
It’s great that journalists and scientists are sharing data and code. But code on GitHub is not always easy to run: you need to reproduce the necessary environment, the operating system, the application, the packages, etc. If your code is already running in the browser, it runs in any other browser; that’s the beauty of the web.
Making code for analysis more portable can have a transformative effect on how we communicate. To quote Victor again:
An active reader asks questions, considers alternatives, questions assumptions, and even questions the trustworthiness of the author. An active reader tries to generalize specific examples, and devise specific examples for generalities. An active reader doesn’t passively sponge up information, but uses the author’s argument as a springboard for critical thought and deep understanding.
Now for the disappointment.
As much as I wanted to release d3.express today to the world, there is still a lot of work to do. If you want to try an early alpha release when it’s available, please sign up at d3.express. If you want to help me build d3.express, that would be great too! Please get in touch. You can find my email address on my GitHub profile and reach me on Twitter.
https://d3.express
Thank you for reading!