
- Simple and powerful syntax to make common charts with minimal code.
- Highly flexible plotting for deep customization.
- Sensible defaults but easy to configure as needed.
- Easily extendable via familiar D3.js syntax.
Contents
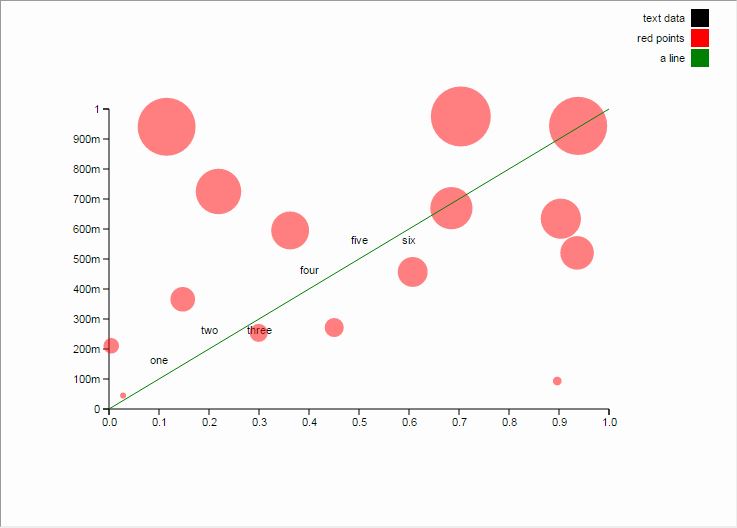
Plot
- labels: (optional) array of strings specifying the label for each dataset applied to the legend.
- datasets: array of objects specifying the data associated with each label. Each dataset is configured with x values, y values, and (optional) z values (size of the points). Each dataset can also take an array of labels (to represent points with words), a color, and a boolean parameter line (to indicate if a line should be drawn through the points).
// generate random data
var randomDataX = [],
randomDataY = [];

for (var i = 0; i < 15; i++) {
randomDataX.push(Math.random());
randomDataY.push(Math.random());
};
//

new D3xter().plot({
labels: ['text data', 'red points', 'a line'],
datasets: [
{
x: [0.1, 0.2, 0.3, 0.4, 0.5, 0.6],
y: [0.15, 0.25, 0.25, 0.45, 0.55, 0.55],
labels: ['one', 'two', 'three', 'four', 'five', 'six'],
color: 'black'
},
{
x: randomDataX,
y: randomDataY,
z: randomDataY,
color: 'red'
},
{
x: [0, 1],
y: [0, 1],
color: 'green',
line: true
}
]
});
Timeline
events: timeline takes an array of objects specifying events to be included in the timeline. Each object is configred with a date string and a label string.
new D3xter().timeline([
{ date: '1914-07-28', label: 'WW1' },
{ date: '1939', label: 'WW2' },
{ date: '1950-01-01', label: 'The Fifties'},
{ date: '1950-01-01', label: 'A Date Collision'},
]);

Bar Chart
- labels: array of strings specifying the label for each dataset applied to the legend.
- groups: array of strings specifying the groups for the x-axis.
- datasets array of objects specifying the data associated with each label. Each dataset is configured with numeric values and (optionally) a color.
var myBar = new D3xter().bar({
labels: ["A", "B", "C"],
groups: ["first", "second", "third"],
datasets: [
{
values: [1, 2, 3],
color: 'red'
},
{
values: [4, 3, 1],
},
{
values: [2, 2, 5],
}
]
});

Histogram
data: hist takes an array of numeric values for which to create the histogram.
var hist = new D3xter().hist(randomData());

// generate random data
function randomData() {
var data = [];
for (var i = 0; i < 25; i++) { data.push(Math.random()) };
return data;
};
//

Pie Chart
values: array of numeric values which define the size of the slices of the pie chart.
labels: (optional) array of string labels used for the legend.
new D3xter().pie({
values: [1, 2, 3, 4],
labels: ['A', 'B', 'C', 'D']
});

Configuration
Charts can be optionally configured. xLab and yLab take string values for the x and y axis labels.title takes a string for a chart title. height and width are used to define the dimensions of the SVG. selector is used to determine which DOM element the SVG will be attached to. legend is a boolean value which can be used to exclude the default legend (where applicable).
var config = {
xLab: 'Groups',
yLab: 'Heights',
title: 'My Bar Chart',
selector: 'body',
height: 500,
width: 700,
legend: false
};

var myBar = new D3xter(config).bar({
labels: ["A", "B", "C"],
groups: ["first", "second", "third"],
datasets: [
{ values: [1, 2, 3] },
{ values: [4, 3, 1] },
{ values: [2, 2, 5] }
]
});

Extension
Charts can easily be extended with D3 syntax. Each D3xter chart has a canvas attribute which returns the SVG on which the chart is drawn. D3 syntax can be applied to this canvas as it would be to any SVG. Charts also have xMap and yMap attributes. These are functions which map values from the data domain/range to the appropriate x/y values.
// make chart
var myPlot = new D3xter().plot({
datasets: [
{
x: [1, 2, 3, 4, 5, 6, 7, 8, 9],
y: [1, 2, 3, 4, 5, 6, 7, 8, 9]
}
]
});

// extend with D3 syntax
var svg = myPlot.canvas;

svg.selectAll('circle')
 .style('fill', 'red')
 .attr('opacity', 0.3);

svg.append('circle')
 .attr('r', 10)
 .attr('cx', myPlot.xMap(5))
 .attr('cy', myPlot.yMap(8))
 .style('fill', 'green');
